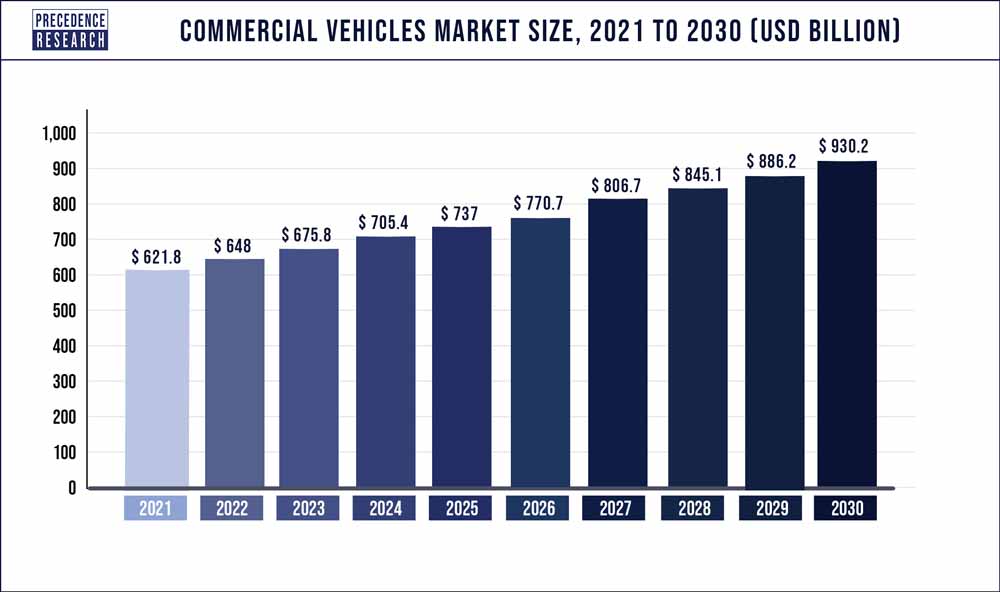
The global commercial vehicles market size was valued at USD 621.8 billion in 2021 and is expected to hit USD 930.2 billion by 2030 with a CAGR of 4.1% from 2022 to 2030.

Key Takeaway
- North America has held highest revenue share in 2021.
- Asia-Pacific region is estimated to observe the fastest expansion during the forecast period.
- By product, the light commercial vehicles segment captured the largest market share in 2022.
- By product, the heavy trucks product segment is expected to expand at the fastest CAGR of 4.6% between 2022 to 2030.
- By Propulsion Type, the IC engine has held highest revenue share in 2022.
- By Power Source, the diesel segment contributed the largest market share in 2022.
Commercial vehicle is a type of vehicle that is used mainly for transporting people, goods, and providing other types of services. They contribute significantly to the economy of a country. They are used for various applications such as logistics, passenger transportation, industrial, mining & construction, and many more. Commercial vehicles are further classified as light commercial vehicle and heavy commercial vehicle. Heavy commercial vehicles are generally used for transporting heavy equipment or goods whereas light commercial vehicles are used in passenger transportation and small logistics work.
Request COVID-19 Impact Analysis on This Market@ https://www.precedenceresearch.com/sample/1062
Report Scope of the Commercial Vehicles Market
| Report Coverage | Details |
| Market Size in 2021 | USD 621.8 Billion |
| Market Size by 2030 | USD 930.2 Billion |
| Growth Rate from 2023 to 2032 | CAGR of 4.1% |
| Fastest Growing Market | Asia Pacific |
| Largest Market | North America |
| Base Year | 2021 |
| Forecast Period | 2022 to 2030 |
| Segments Covered | Product, End User, Propulsion Type, Power Source, Region |
Growth Factors
Introduction of telemetric and connectivity have revolutionized operations due to which various original equipment manufacturers (OEMs) have launched commercial vehicles equipped with numerous connected services, such as traffic data, accident warnings, weather reports, and updates on roadwork’s. This contributed as a major factor that fuels the market growth. Furthermore, developments in the field of semi-autonomous commercial vehicles as well as electric vehicles (EVs) expected to positively influence the market growth over the forecast period. Advent of vehicle electrification and battery-powered engines expected to fuel the demand for light commercial vehicles in the coming years.
Further, growth in the industrial sector also escalates the demand for LCV prominently. However, buses and coaches segment expected to gain traction over the analysis period due to its rising adoption in the healthcare and tourism sector. Governments of various regions have significantly implemented the green mobility and rapidly replacing traditional buses and other mode of public transport into smart and electric based vehicles that prominently fuels the growth of the segment.
Report Highlights
- North America captured maximum market value share in the global commercial vehicles market and anticipated to grow at a considerable rate during the forecast period.
- The Asia Pacific registered the highest growth rate over the analysis period. This is attributed to the increasing road infrastructure along with rising manufacturing facilities due to cost-effective raw materials and labor, particularly in the developing countries such as India and China.
- Based on product, Light Commercial Vehicles (LCVs) led the global commercial vehicles market with significant revenue share of around 75% and predicted to retain its position during the forecast period. In 2019, passenger transportation accounted for significant market value share and predicted to exhibit lucrative growth rate of nearly 8% over the forecast period. Rising expenditure on commutation to improve accessibility and affordability is one of the prime factors that escalate the growth of the segment.
- Logistics segment witnessed prominent demand in the past few years owing to the growth in trade activities worldwide. Moreover, the segment captured remarkable revenue share in 2019 due to increasing penetration of e-commerce and retail business.
Regional Snapshots
North America occupied the largest revenue share in the global commercial vehicles market in 2019 and projected to continue the same trend over the analysis period. This is attributed to the significant government support for the adoption of smart and environment-friendly vehicles in the region. Rate of carbon emission and greenhouse gas has crossed the environment standard in the region. In order to curb the emission from transportation sector government has issued attractive policies to promote the adoption of electric vehicles across the region. Significant development in the industrial sector along with stringent government norms pertaining to load carrying capacity of the commercial vehicles is the prime factor that triggers the growth of the region.
On the other hand, the Asia Pacific registered the fastest growth over the analysis period. Rising investment in road and transport infrastructure along with increasing manufacturing facilities particularly in the developing nations such as India and China accounted as the prime factors to drive the growth of the region. In addition, green revolution in various countries in order to favor the green mobility solution and other smart & attractive solutions in other sectors expected to propel the adoption of advanced vehicle solutions, thereby fuelling the growth of the region.
Read Also: Automotive Aftermarket Size to Reach US$ 1167.09 Billion by 2030
Key Players & Strategies
The global commercial vehicles market is a matured market and expected to be dominated by the presence of major market players. In 2019, major portion of the revenue share was captured by some of the industry participants that include Volkswagen AG, Tata Motors, Volvo Car Corporation, Ashok Leyland, and General Motors. These players are significantly focusing towards vertical integration in value chain to speed up their production process. In the wake of same, Original Equipment Manufacturers (OEMs) are adopting partnership, collaboration, and merger & acquisition strategies.
Some of the prominent players in the commercial vehicles market include:
- Bosch Rexroth AG
- Ashok Leyland
- Daimler
- Toyota Motor Corporation
- Volkswagen AG
- Mahindra and Mahindra
- VOLVO
- TATA Motors
- General Motors
- Golden Dragon
Segments Covered in the Report
By Product
- Light Commercial Vehicles (LCVs)
- Buses & Coaches
- Heavy Trucks
By End-use
- Mining & Construction
- Industrial
- Passenger Transportation
- Logistics
- Others
By Propulsion Type
- IC Engine
- Electric Vehicle
By Power Source
- Gasoline
- Diesel
- HEV / PHEV
- Battery Electric Vehicle (BEV)
- Fuel Cell Vehicle
- LPG & Natural Gas
By Geography
- North America
- U.S.
- Canada
- Europe
- U.K.
- Germany
- France
- Asia-Pacific
- China
- India
- Japan
- South Korea
- Malaysia
- Philippines
- Latin America
- Brazil
- Rest of Latin America
- Middle East & Africa (MEA)
- GCC
- North Africa
- South Africa
- Rest of the Middle East & Africa
Table of Content
Chapter 1. Introduction
1.1. Research Objective
1.2. Scope of the Study
1.3. Definition
Chapter 2. Research Methodology
2.1. Research Approach
2.2. Data Sources
2.3. Assumptions & Limitations
Chapter 3. Executive Summary
3.1. Market Snapshot
Chapter 4. Market Variables and Scope
4.1. Introduction
4.2. Market Classification and Scope
4.3. Industry Value Chain Analysis
Chapter 5. Market Dynamics Analysis and Trends
5.1. Market Dynamics
5.1.1. Market Drivers
5.1.2. Market Restraints
5.1.3. Market Opportunities
5.2. Porter’s Five Forces Analysis
5.2.1. Bargaining power of suppliers
5.2.2. Bargaining power of buyers
5.2.3. Threat of substitute
5.2.4. Threat of new entrants
5.2.5. Degree of competition
Chapter 6. Competitive Landscape
6.1.1. Company Market Share/Positioning Analysis
6.1.2. Key Strategies Adopted by Players
6.1.3. Vendor Landscape
6.1.3.1. List of Suppliers
6.1.3.2. List of Buyers
Chapter 7. Global Commercial Vehicles Market, By Product
7.1. Commercial Vehicles Market, by Product Type, 2020-2030
7.1.1. Light Commercial Vehicles (LCVs)
7.1.1.1. Market Revenue and Forecast (2019-2030)
7.1.2. Buses & Coaches
7.1.2.1. Market Revenue and Forecast (2019-2030)
7.1.3. Heavy Trucks
7.1.3.1. Market Revenue and Forecast (2019-2030)
Chapter 8. Global Commercial Vehicles Market, By End-User
8.1. Commercial Vehicles Market, by End-User, 2020-2030
8.1.1. Mining & Construction
8.1.1.1. Market Revenue and Forecast (2019-2030)
8.1.2. Industrial
8.1.2.1. Market Revenue and Forecast (2019-2030)
8.1.3. Passenger Transportation
8.1.3.1. Market Revenue and Forecast (2019-2030)
8.1.4. Logistics
8.1.4.1. Market Revenue and Forecast (2019-2030)
8.1.5. Others
8.1.5.1. Market Revenue and Forecast (2019-2030)
Chapter 9. Global Commercial Vehicles Market, Regional Estimates and Trend Forecast
9.1. North America
9.1.1. Market Revenue and Forecast, by Product (2019-2030)
9.1.2. Market Revenue and Forecast, by End-User (2019-2030)
9.1.3. U.S.
9.1.3.1. Market Revenue and Forecast, by Product (2019-2030)
9.1.3.2. Market Revenue and Forecast, by End-User (2019-2030)
9.1.4. Rest of North America
9.1.4.1. Market Revenue and Forecast, by Product (2019-2030)
9.1.4.2. Market Revenue and Forecast, by End-User (2019-2030)
9.2. Europe
9.2.1. Market Revenue and Forecast, by Product (2019-2030)
9.2.2. Market Revenue and Forecast, by End-User (2019-2030)
9.2.3. UK
9.2.3.1. Market Revenue and Forecast, by Product (2019-2030)
9.2.3.2. Market Revenue and Forecast, by End-User (2019-2030)
9.2.4. Germany
9.2.4.1. Market Revenue and Forecast, by Product (2019-2030)
9.2.4.2. Market Revenue and Forecast, by End-User (2019-2030)
9.2.5. France
9.2.5.1. Market Revenue and Forecast, by Product (2019-2030)
9.2.5.2. Market Revenue and Forecast, by End-User (2019-2030)
9.2.6. Rest of Europe
9.2.6.1. Market Revenue and Forecast, by Product (2019-2030)
9.2.6.2. Market Revenue and Forecast, by End-User (2019-2030)
9.3. APAC
9.3.1. Market Revenue and Forecast, by Product (2019-2030)
9.3.2. Market Revenue and Forecast, by End-User (2019-2030)
9.3.3. India
9.3.3.1. Market Revenue and Forecast, by Product (2019-2030)
9.3.3.2. Market Revenue and Forecast, by End-User (2019-2030)
9.3.4. China
9.3.4.1. Market Revenue and Forecast, by Product (2019-2030)
9.3.4.2. Market Revenue and Forecast, by End-User (2019-2030)
9.3.5. Japan
9.3.5.1. Market Revenue and Forecast, by Product (2019-2030)
9.3.5.2. Market Revenue and Forecast, by End-User (2019-2030)
9.3.6. Rest of APAC
9.3.6.1. Market Revenue and Forecast, by Product (2019-2030)
9.3.6.2. Market Revenue and Forecast, by End-User (2019-2030)
9.4. MEA
9.4.1. Market Revenue and Forecast, by Product (2019-2030)
9.4.2. Market Revenue and Forecast, by End-User (2019-2030)
9.4.3. GCC
9.4.3.1. Market Revenue and Forecast, by Product (2019-2030)
9.4.3.2. Market Revenue and Forecast, by End-User (2019-2030)
9.4.4. North Africa
9.4.4.1. Market Revenue and Forecast, by Product (2019-2030)
9.4.4.2. Market Revenue and Forecast, by End-User (2019-2030)
9.4.5. South Africa
9.4.5.1. Market Revenue and Forecast, by Product (2019-2030)
9.4.5.2. Market Revenue and Forecast, by End-User (2019-2030)
9.4.6. Rest of MEA
9.4.6.1. Market Revenue and Forecast, by Product (2019-2030)
9.4.6.2. Market Revenue and Forecast, by End-User (2019-2030)
9.5. Latin America
9.5.1. Market Revenue and Forecast, by Product (2019-2030)
9.5.2. Market Revenue and Forecast, by End-User (2019-2030)
9.5.3. Brazil
9.5.3.1. Market Revenue and Forecast, by Product (2019-2030)
9.5.3.2. Market Revenue and Forecast, by End-User (2019-2030)
9.5.4. Rest of LATAM
9.5.4.1. Market Revenue and Forecast, by Product (2019-2030)
9.5.4.2. Market Revenue and Forecast, by End-User (2019-2030)
Chapter 10. Company Profiles
10.1. Bosch Rexroth AG
10.1.1. Company Overview
10.1.2. Product Offerings
10.1.3. Financial Performance
10.1.4. Recent Initiatives
10.2. Ashok Leyland
10.2.1. Company Overview
10.2.2. Product Offerings
10.2.3. Financial Performance
10.2.4. Recent Initiatives
10.3. Daimler
10.3.1. Company Overview
10.3.2. Product Offerings
10.3.3. Financial Performance
10.3.4. Recent Initiatives
10.4. Toyota Motor Corporation
10.4.1. Company Overview
10.4.2. Product Offerings
10.4.3. Financial Performance
10.4.4. Recent Initiatives
10.5. Volkswagen AG
10.5.1. Company Overview
10.5.2. Product Offerings
10.5.3. Financial Performance
10.5.4. Recent Initiatives
10.6. Mahindra and Mahindra
10.6.1. Company Overview
10.6.2. Product Offerings
10.6.3. Financial Performance
10.6.4. Recent Initiatives
10.7. VOLVO
10.7.1. Company Overview
10.7.2. Product Offerings
10.7.3. Financial Performance
10.7.4. Recent Initiatives
10.8. TATA Motors
10.8.1. Company Overview
10.8.2. Product Offerings
10.8.3. Financial Performance
10.8.4. Recent Initiatives
10.9. General Motors
10.9.1. Company Overview
10.9.2. Product Offerings
10.9.3. Financial Performance
10.9.4. Recent Initiatives
10.10. Golden Dragon
10.10.1. Company Overview
10.10.2. Product Offerings
10.10.3. Financial Performance
10.10.4. Recent Initiatives
Chapter 11. Research Methodology
11.1. Primary Research
11.2. Secondary Research
11.3. Assumptions
Chapter 12. Appendix
12.1. About Us
12.2. Glossary of Terms
Contact Us:
Mr. Alex
Sales Manager
Call: +1 9197 992 333
Email: sales@precedenceresearch.com
Web: https://www.precedenceresearch.com

